Reading Footprint Charts: A Practical Guide to Order Flow
Footprint charts show you exactly where volume traded inside every candle. Here's how to actually read one without getting lost in the numbers.
HODLChart Team
June 2, 2026 · 3 min read
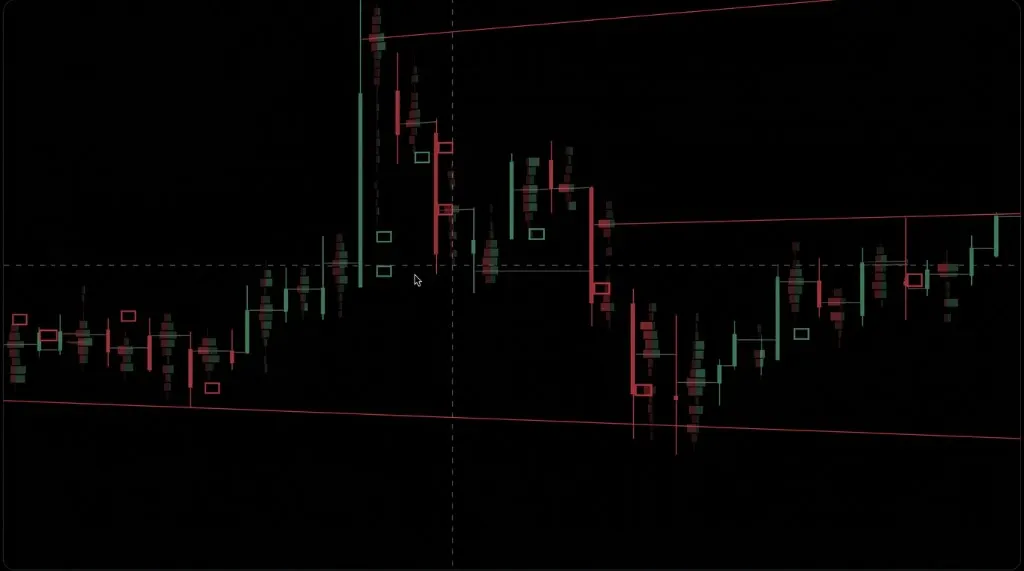
A regular candlestick tells you open, high, low, and close. That's it. A footprint chart tells you what actually happened inside the candle — how much volume traded at every price level, and whether buyers or sellers were the aggressor at each one. Once you can read a footprint, wicks stop being mysterious and start being data.
What a footprint chart actually shows
Each candle is split into rows, one per price level the market traded at during that period. Every row shows two numbers: contracts (or coins) bought at the ask, and contracts sold at the bid. Stack enough of these rows and you get a vertical map of exactly where size traded — not just where price ended up.
This matters because price alone hides intent. A candle can close green while the footprint shows heavy selling absorbed by a single price level. That's the kind of detail a wick can never tell you.
The three views every trader should know
Volume footprint
Shows total traded volume at each price, regardless of side. Useful for spotting where the real battle happened inside a candle — the thickest row is usually where the market found the most resistance to moving further.
Delta footprint
Shows buy volume minus sell volume at each price. Positive delta means aggressive buyers won that level; negative means aggressive sellers did. Delta is where you start seeing divergences — price pushing up while delta quietly turns negative is one of the most reliable early warnings in order flow.
Bid/ask footprint
The full breakdown: bid volume and ask volume printed side by side at every price. This is the most granular view and the one you'll use to spot absorption and imbalance clusters — stacks of 3+ price levels where one side is dramatically outsized (commonly 300%+) compared to the other.
Reading absorption vs. exhaustion
Two patterns show up constantly once you start reading footprints, and they mean opposite things.
- Absorption: heavy volume prints at a level but price barely moves. A large passive order is soaking up aggression — often a sign the move is about to reverse.
- Exhaustion: volume shrinks even as price keeps extending in one direction. The aggressive side is running out of size to push with — often precedes a stall or pullback.
- Unfinished business: a candle closes with volume still stacked at the high or low with no opposite-side response. That level frequently gets revisited.
- Delta divergence: price makes a new high/low but cumulative delta doesn't confirm it — one of the cleanest reversal signals in order flow.
Candlesticks show you where price went. Footprints show you why.
A simple footprint checklist before you enter
- Identify the higher-timeframe context first — footprints are a confirmation tool, not a standalone strategy.
- Look for imbalance clusters stacking in the direction of your bias (3+ consecutive levels).
- Check for absorption at the level you're trading against — if it's there, stand down.
- Confirm with cumulative delta trending the same direction as price.
- Size your stop just beyond the unfinished business from the setup candle, not an arbitrary distance.
Common mistakes beginners make
- Reading a single candle's footprint in isolation instead of the sequence leading into it.
- Ignoring volume profile context — a footprint signal at a high-volume node means far more than the same signal in thin air.
- Treating every imbalance as a signal. Most are noise; the ones that matter cluster and repeat.
- Trading footprints on illiquid pairs where a handful of orders can distort the whole picture.
Footprint reading is a skill you build one session at a time, but it compounds fast — the moment you stop asking 'where did price go' and start asking 'who traded and how aggressively,' the chart tells a completely different story.
Keep reading
 Order Flow
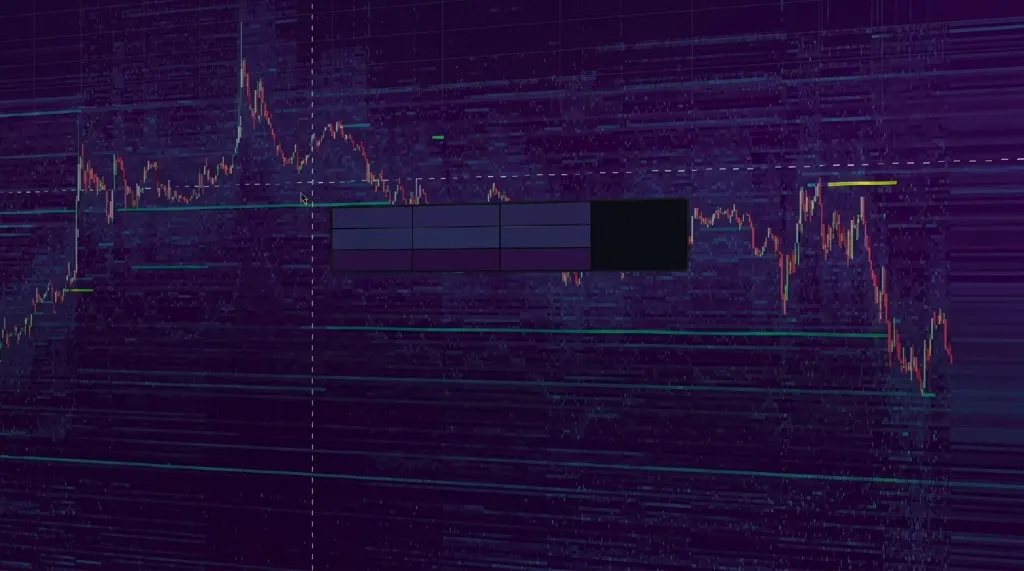
Order Book Heatmaps Explained: Spotting Spoofed Liquidity
Not every wall on the order book is real. Here's how to use a depth heatmap to tell genuine liquidity apart from bait — before it moves against you.
 Order Flow
Spot vs. Perp CVD: The Divergence That Front-Runs Reversals
When leveraged traders and real spot buyers disagree, price usually sides with spot. Here's how to read the CVD divergence most charts hide from you.
 Derivatives
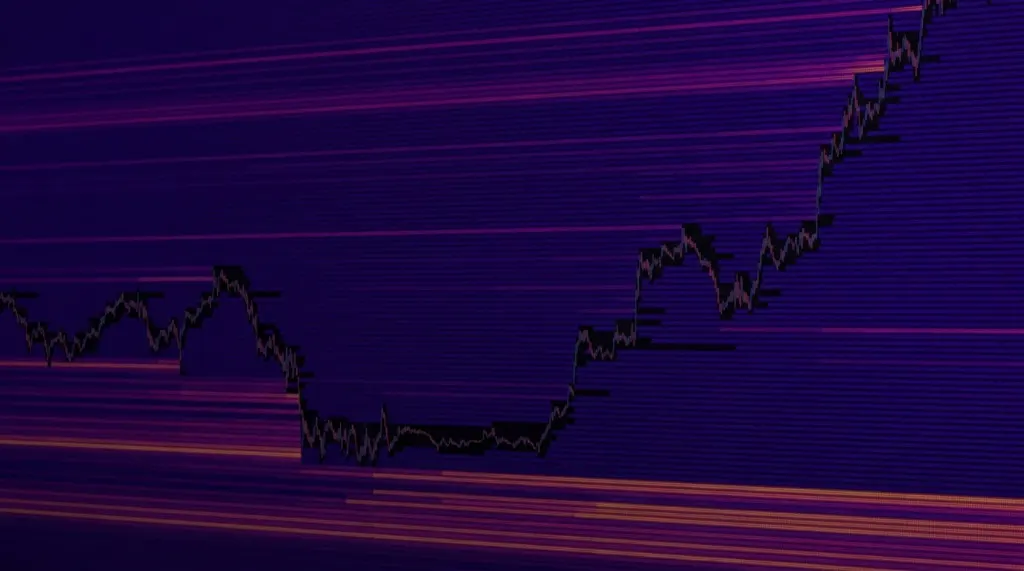
Liquidation Maps 101: Trading the Squeeze Before It Happens
Leveraged positions have a breaking point, and those breaking points cluster. Here's how to read a liquidation map before the cascade, not after.
Stop guessing. Start reading the tape.
Full Pro terminal, free while we're in early access. Every day without it is a day trading blind.
No credit card · Full Pro during early access