Order Book Heatmaps Explained: Spotting Spoofed Liquidity
Not every wall on the order book is real. Here's how to use a depth heatmap to tell genuine liquidity apart from bait — before it moves against you.
HODLChart Team
June 10, 2026 · 2 min read
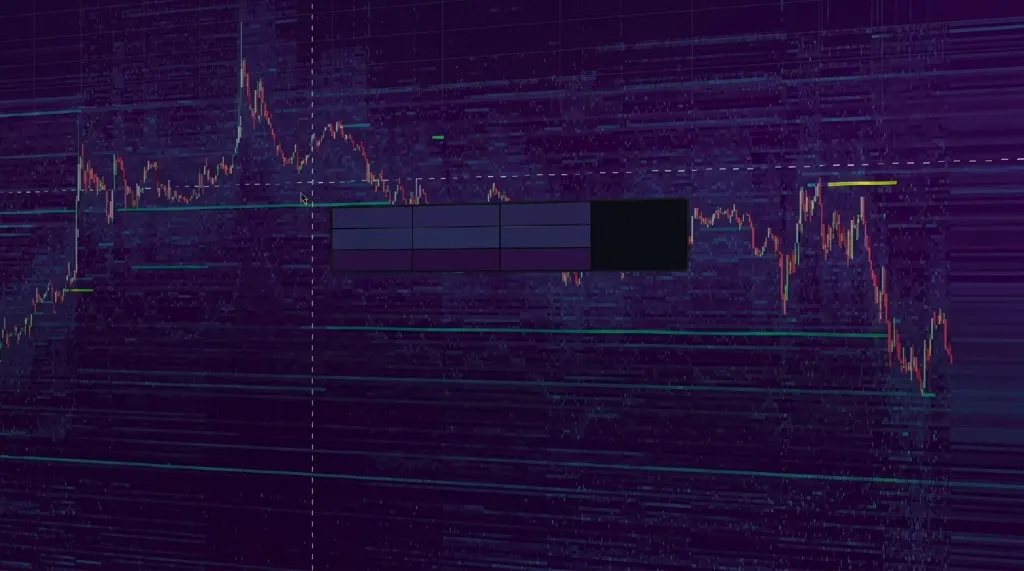
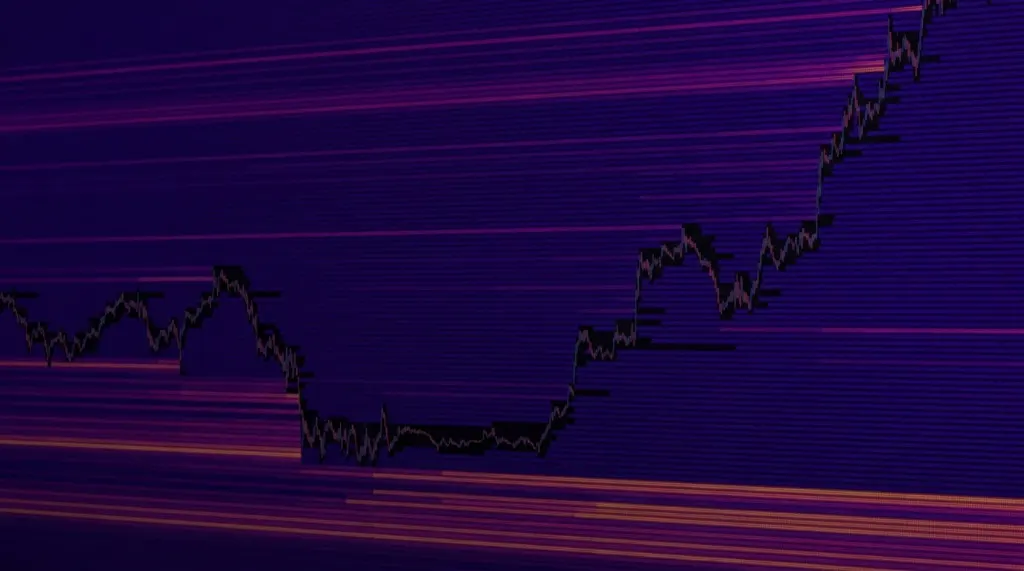
An order book heatmap plots resting bid and ask liquidity across price, over time, as a color-coded map — brighter means more size resting at that level. It turns a static snapshot of the book into a moving picture of where liquidity actually sits, and more importantly, where it disappears the moment price gets close.
What an order book heatmap is
Instead of scrolling through a raw order book that resets every second, a heatmap accumulates depth data on a time axis. Walls of resting size show up as bright horizontal bands. Because the axis is time, you can watch how those bands behave — do they hold as price approaches, or do they vanish the instant it gets close?
Real liquidity vs. spoofed walls
Signs of a spoof
- The wall appears suddenly, far from current price, with no organic buildup.
- It pulls the instant price trades within a few ticks — canceled before it's ever hit.
- It reappears repeatedly at round numbers with identical size, a pattern algorithmic spoofing often leaves behind.
- Price stalls near the wall (traders reacting to it) even though the wall itself never actually absorbs volume.
Signs of real liquidity
- The level actually absorbs trades — you'll see it in the footprint as heavy volume with price barely moving.
- Size refills after being partially eaten, rather than vanishing outright.
- It aligns with a genuine structural level: a prior high-volume node, a liquidation cluster, or a well-tested support/resistance zone.
The tell that matters most
Spoofed walls almost never get touched. Watch what happens the moment price actually trades into the level — real liquidity fights back, fake liquidity disappears.
How to trade around heatmap signals
The heatmap alone isn't a signal generator — it's context. Used well, it tells you where the crowd is watching and whether that attention is backed by real orders.
- Note where big walls sit relative to your bias — they're either targets (real liquidity) or traps (spoofed).
- Cross-check with the footprint the moment price reaches the level: absorption confirms it's real.
- If a wall pulls right before price would have hit it, treat that direction with extra caution — it was likely bait, and the move that follows is often sharper than usual.
- Never place a stop right behind an obvious wall. If it's spoofed, your stop gets run exactly where the wall used to sit.
Heatmap + footprint = full picture
A heatmap shows you where resting orders are sitting. A footprint shows you what actually traded. Neither is complete without the other — the heatmap flags the level worth watching, and the footprint confirms whether real size showed up when price got there. Traders who only look at one are working with half the information.
Spoofing isn't going away — it's a permanent feature of thin, fast-moving crypto order books. Reading a heatmap isn't about eliminating it. It's about not being the liquidity that spoof was designed to trap.
Keep reading
 Order Flow
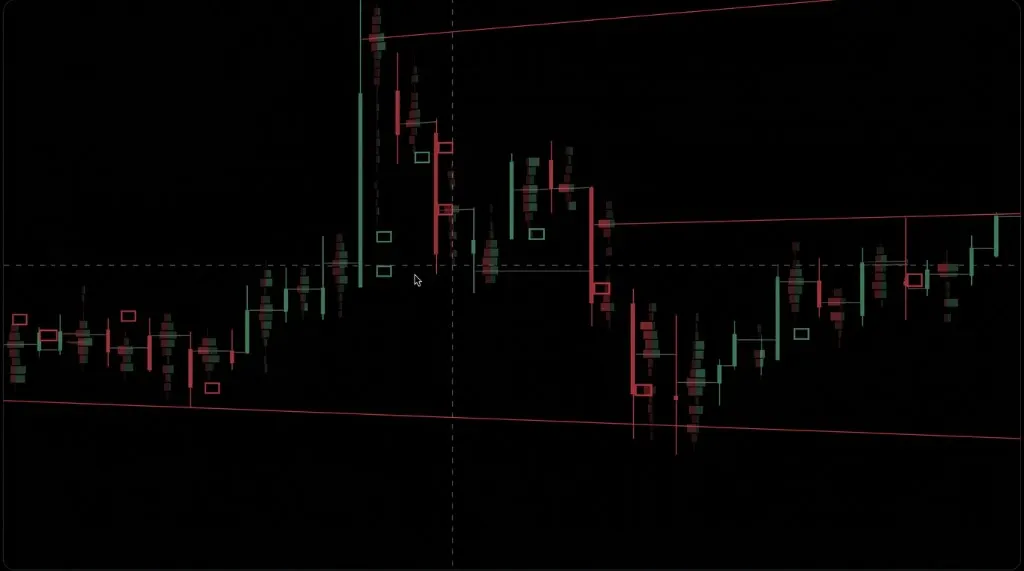
Reading Footprint Charts: A Practical Guide to Order Flow
Footprint charts show you exactly where volume traded inside every candle. Here's how to actually read one without getting lost in the numbers.
 Order Flow
Spot vs. Perp CVD: The Divergence That Front-Runs Reversals
When leveraged traders and real spot buyers disagree, price usually sides with spot. Here's how to read the CVD divergence most charts hide from you.
 Derivatives
Liquidation Maps 101: Trading the Squeeze Before It Happens
Leveraged positions have a breaking point, and those breaking points cluster. Here's how to read a liquidation map before the cascade, not after.
Stop guessing. Start reading the tape.
Full Pro terminal, free while we're in early access. Every day without it is a day trading blind.
No credit card · Full Pro during early access