Liquidation Maps 101: Trading the Squeeze Before It Happens
Leveraged positions have a breaking point, and those breaking points cluster. Here's how to read a liquidation map before the cascade, not after.
HODLChart Team
June 18, 2026 · 2 min read
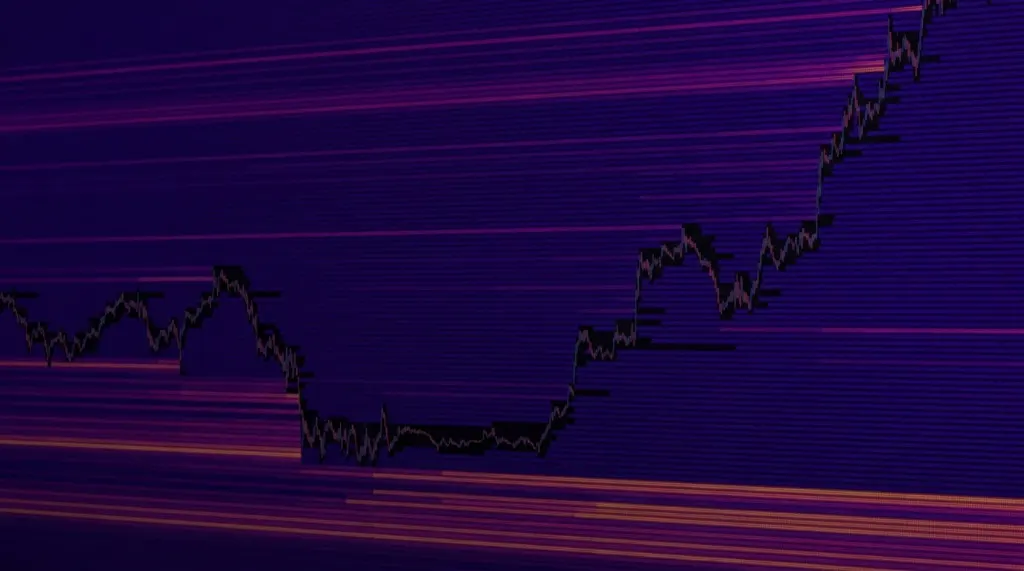
Every leveraged position has an exact price where it gets force-closed. On its own, one liquidation is nothing. But when thousands of traders open positions around similar entries and similar leverage, their liquidation prices stack on top of each other — and that stack becomes fuel for the next big move.
How liquidation clusters form
Retail leverage tends to concentrate around recent highs, lows, and round numbers — the same levels everyone's watching. A trader who longs at $60,000 with 20x leverage gets liquidated around $57,000. Thousands of similar entries create a dense band of forced sell orders sitting just below price. That band is a liquidation cluster, and a liquidation map plots exactly where it sits, sized by estimated leveraged exposure.
Reading a liquidation map
Long liquidation zones
Sit below current price. When price drops into one, longs get force-sold, adding to the downward pressure — which can drag price into the next cluster, and the next. This is what a 'long squeeze' actually is: forced selling feeding on itself.
Short liquidation zones
Sit above current price. A move up into a dense short cluster forces shorts to buy back to close, adding fuel to the rally. Fast, violent green candles with no obvious news are almost always a short squeeze eating through a liquidation cluster.
Squeeze mechanics: cascades explained
- Price approaches a dense cluster — often after a period of low volatility that let leverage build up quietly.
- The first liquidations trigger, adding forced volume in the direction price is already moving.
- That extra volume pushes price into the next cluster, triggering more liquidations — the cascade effect.
- The move exhausts once it clears the dense zone and hits an area with thinner leveraged exposure, often snapping back hard once forced selling/buying stops.
The market doesn't need news to move violently. It just needs enough leverage sitting in one place.
Risk management around liquidation zones
- Never place your stop directly inside a visible liquidation cluster — that's exactly where the wick will go to trigger it.
- Treat approaching a dense cluster as a volatility warning, not a trade signal by itself — wait for the cascade to actually start or confirm exhaustion first.
- Reduce leverage when your own liquidation price sits inside a cluster other traders can see too — you're the fuel, not the trader, in that scenario.
- After a cascade clears a zone, watch for the snapback: exhausted moves often reclaim a meaningful chunk of the range once forced flow dries up.
Liquidation maps won't tell you the future. What they tell you is where leverage is sitting right now, and leverage is one of the few things in this market that behaves predictably under pressure — it always gets liquidated in the same direction price is moving.
Keep reading
DerivativesFunding Rates Explained: The Cost of Being Wrong With the Crowd
The funding rate is the price of holding a leveraged position — and at extremes, one of the cleanest reversal warnings in crypto. Here's how to read it.
 Order Flow
Reading Footprint Charts: A Practical Guide to Order Flow
Footprint charts show you exactly where volume traded inside every candle. Here's how to actually read one without getting lost in the numbers.
 Order Flow
Order Book Heatmaps Explained: Spotting Spoofed Liquidity
Not every wall on the order book is real. Here's how to use a depth heatmap to tell genuine liquidity apart from bait — before it moves against you.
Stop guessing. Start reading the tape.
Full Pro terminal, free while we're in early access. Every day without it is a day trading blind.
No credit card · Full Pro during early access