Market Profile vs. Volume Profile: Finding True Value Areas
Both build a picture of 'fair value' from the same session — but they measure completely different things. Here's when to use each one.
HODLChart Team
June 25, 2026 · 2 min read
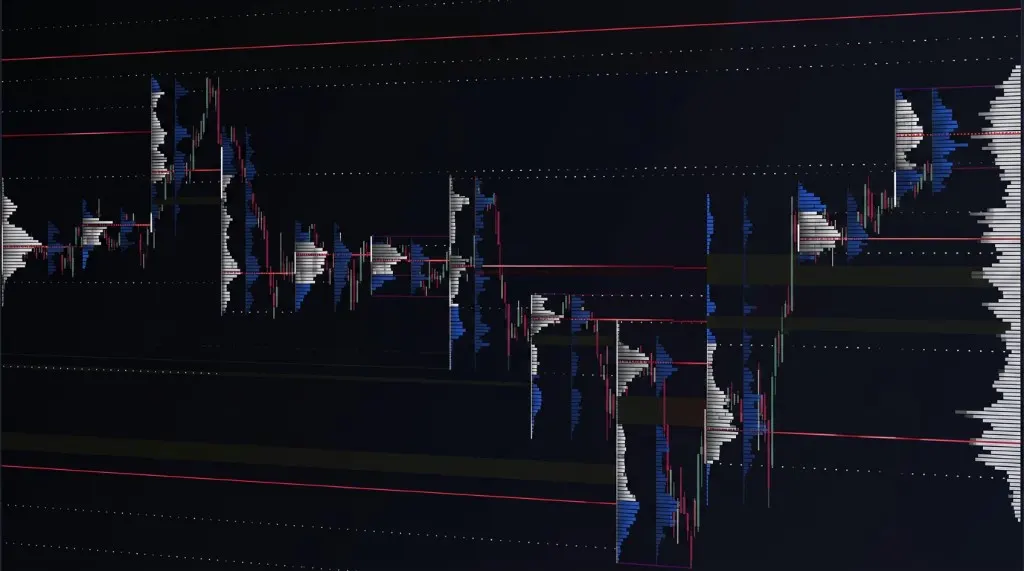
Ask ten traders what 'value area' means and you'll get answers built on two different tools that get confused constantly: Market Profile (TPO) and Volume Profile. They often produce similar-looking charts, which is exactly why people assume they're interchangeable. They're not — and knowing the difference changes how you read them.
What is Market Profile (TPO)
Market Profile uses Time Price Opportunity (TPO) — it counts how many time periods (typically 30-minute blocks) traded at each price. A price level that gets touched across many periods builds a tall TPO column, regardless of how much volume actually traded there. It was built for markets where per-price volume data wasn't reliably available, so it uses time as a proxy for interest.
What is Volume Profile
Volume Profile skips the time proxy entirely and plots actual traded volume at each price. In crypto, where exact volume data is abundant, this is the more direct measurement — a price level with a tall volume bar genuinely had heavy trading there, not just repeated visits.
Key differences
Time vs. traded volume
TPO can overweight a level the market simply sat at for a long time with thin volume (think a slow overnight session). Volume Profile won't be fooled by that — it only cares how much actually traded, so a fast, high-volume spike gets full weight even if it lasted seconds.
When each shines
TPO is strong for reading market structure and session shape — spotting balance, imbalance, and how a session's range develops over time. Volume Profile is stronger for pinpointing exact price levels with real participation, which makes it the better tool for setting entries, stops, and targets in fast crypto markets.
Reading value areas, POC, and balance
- Point of Control (POC): the single price with the most activity — the fairest price of the session by definition.
- Value Area: typically the range containing 70% of activity around the POC — the zone the market considered 'fair' most of the time.
- Balance: price spending extended time inside the value area, digesting, without direction — often precedes a breakout.
- Imbalance: price rejecting quickly outside the value area — a sign the market found that price unfair and moved on.
Value areas aren't support and resistance. They're where the market already agreed on price — which is exactly why they get revisited.
Combining both for confluence
The strongest levels are where TPO and Volume Profile agree — a price the market kept returning to across many periods, backed by genuinely heavy volume. When they diverge, trust Volume Profile for entries and use TPO to understand the broader session structure around it. Neither replaces the other; they answer different questions about the same data.
Keep reading
 Order Flow
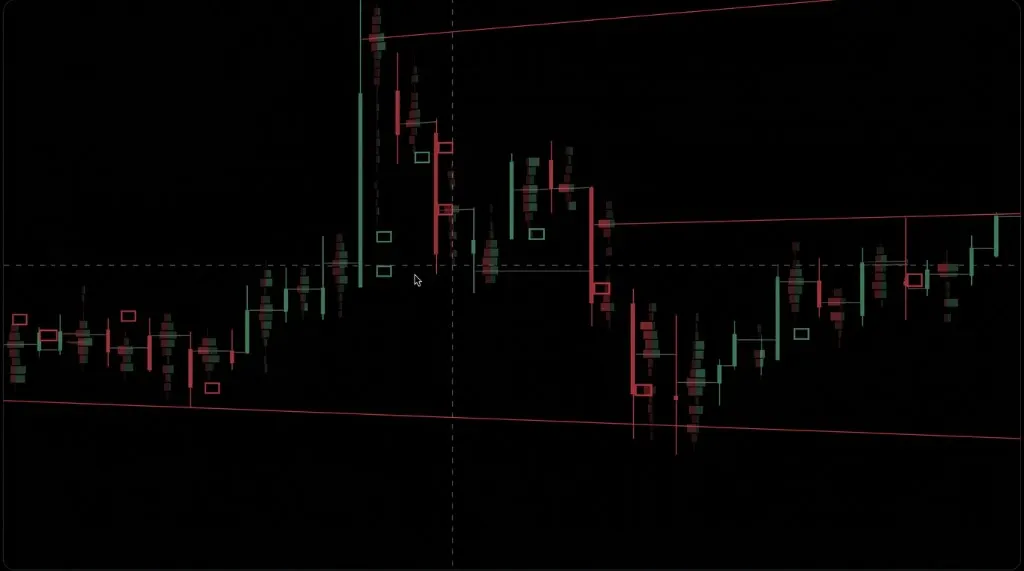
Reading Footprint Charts: A Practical Guide to Order Flow
Footprint charts show you exactly where volume traded inside every candle. Here's how to actually read one without getting lost in the numbers.
 Order Flow
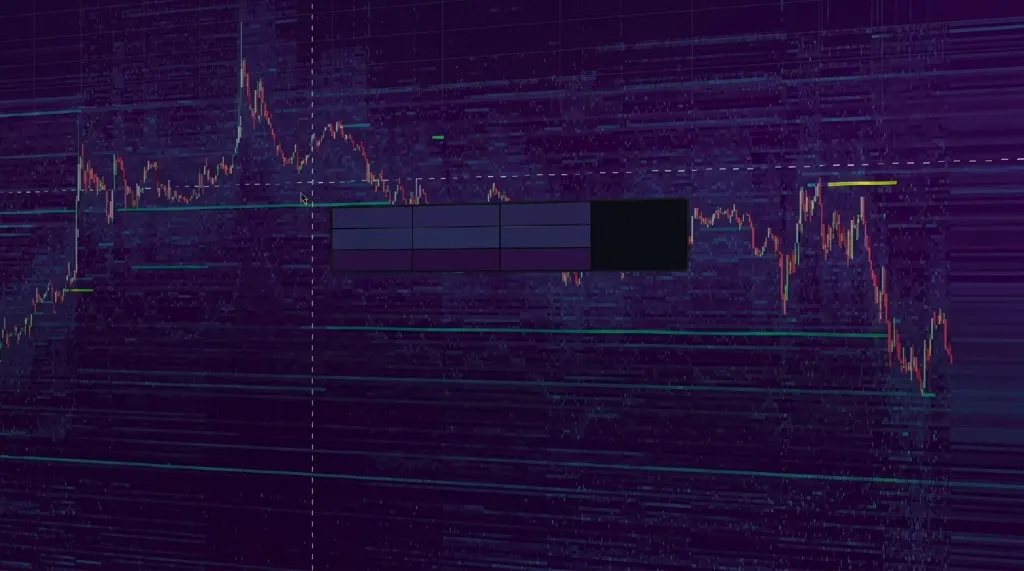
Order Book Heatmaps Explained: Spotting Spoofed Liquidity
Not every wall on the order book is real. Here's how to use a depth heatmap to tell genuine liquidity apart from bait — before it moves against you.
 Derivatives
Liquidation Maps 101: Trading the Squeeze Before It Happens
Leveraged positions have a breaking point, and those breaking points cluster. Here's how to read a liquidation map before the cascade, not after.
Stop guessing. Start reading the tape.
Full Pro terminal, free while we're in early access. Every day without it is a day trading blind.
No credit card · Full Pro during early access