Net Longs vs. Shorts: Reading Crowd Positioning Like a Pro
When everyone is leaning the same way, the market has a habit of proving them wrong. Here's how to actually use positioning data instead of just watching it.
HODLChart Team
July 1, 2026 · 3 min read
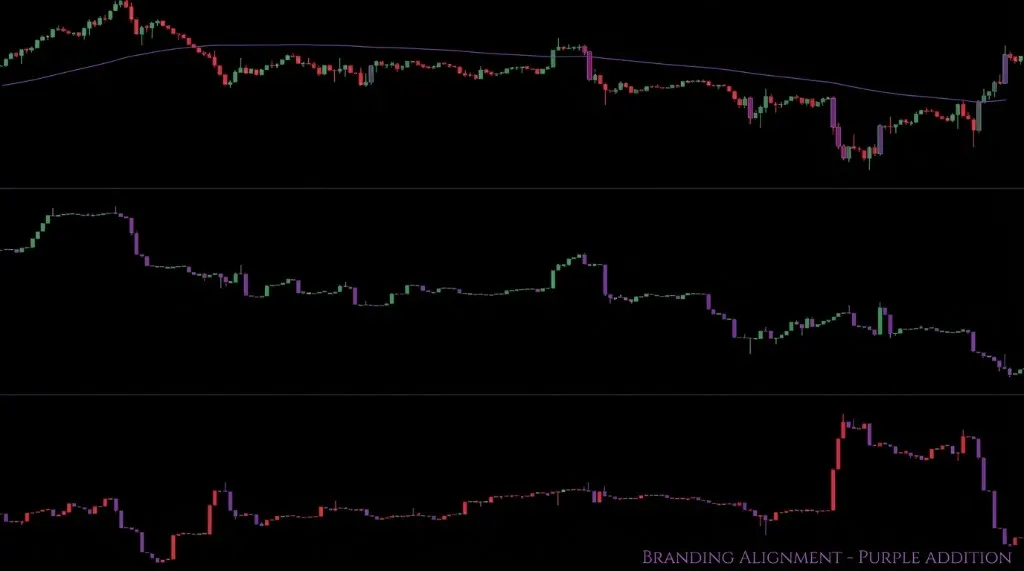
Net long/short data tells you which way leveraged traders are positioned across an exchange or the whole market. It's tempting to read it as a directional signal — 'more longs means price goes up' — but that's backwards more often than it's right. Positioning is a crowding indicator, not a forecast.
What net long/short data actually measures
It's the ratio of open leveraged long exposure to short exposure, usually tracked over time so you can see it building or unwinding. A reading above neutral means longs dominate; below means shorts do. On its own, that's just a snapshot of the crowd's lean — the value comes from watching how extreme that lean gets and how fast it built.
Why extremes matter more than direction
A mild long lean is just normal bull-market behavior and means very little by itself. It's the extremes that matter — when positioning stretches far past its typical range, it usually means the trade is crowded, leverage is high, and there's a large pool of same-side stops sitting close to price.
Crowded longs
Extreme long positioning means a large, leveraged crowd needs price to keep rising just to stay solvent. That crowd is the exact fuel a long-squeeze cascade feeds on — see our piece on liquidation maps for how that plays out in practice.
Crowded shorts
The mirror image — a market leaning heavily short is vulnerable to a violent short squeeze on any unexpected strength, since forced buy-to-close orders can accelerate a move that would otherwise have been unremarkable.
Combining positioning with funding rates
- Positioning shows you the lean; funding rate shows you the cost of holding that lean.
- Persistently high positive funding alongside extreme long positioning is a classic late-cycle warning — longs are paying a premium just to stay in the trade.
- A sudden flip in funding while positioning is still extreme often precedes the unwind — the crowd hasn't left yet, but the cost of staying just changed.
- Funding resetting to neutral after an extreme reading usually means the squeeze already happened — by then, the signal is behind you, not ahead of you.
Positioning data doesn't tell you where price is going. It tells you who's going to be forced to react when it gets there.
A simple framework for fading the crowd
- Track positioning relative to its own recent range, not an arbitrary absolute number — 'extreme' is relative to each asset's normal behavior.
- Wait for positioning and funding to both reach an extreme at the same time before treating it as a real signal.
- Look for a price trigger — a failed breakout or a rejection at a key level — rather than fading the crowd purely because positioning looks stretched.
- Size conservatively: crowded positioning can stay crowded and get more extreme before it finally breaks.
Positioning data is most useful as a warning system, not a trigger. It tells you when the market is one shock away from a forced, leverage-driven move — and pairs best with the order-flow tools that show you exactly when that shock starts.
Keep reading
 Order Flow
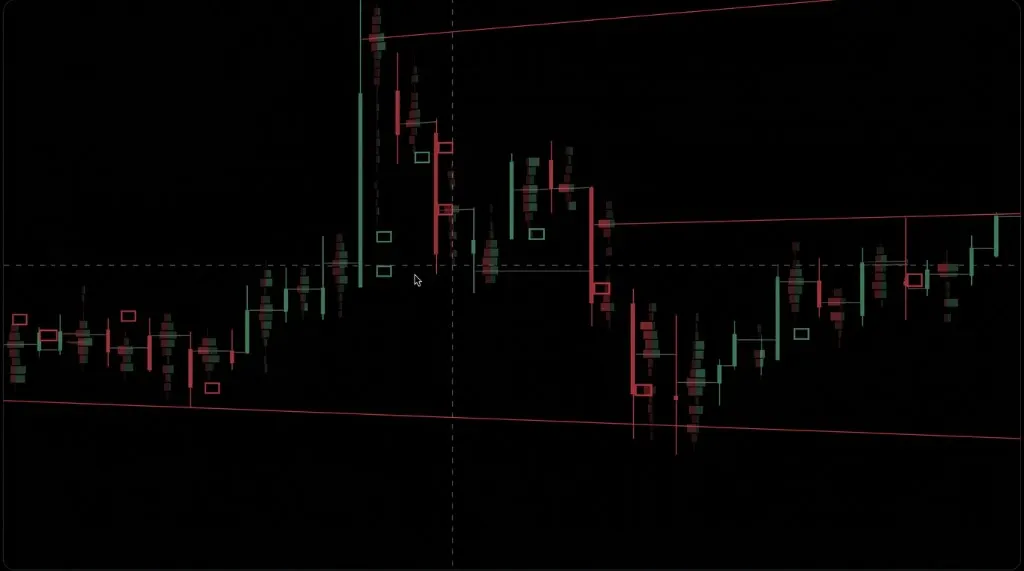
Reading Footprint Charts: A Practical Guide to Order Flow
Footprint charts show you exactly where volume traded inside every candle. Here's how to actually read one without getting lost in the numbers.
 Order Flow
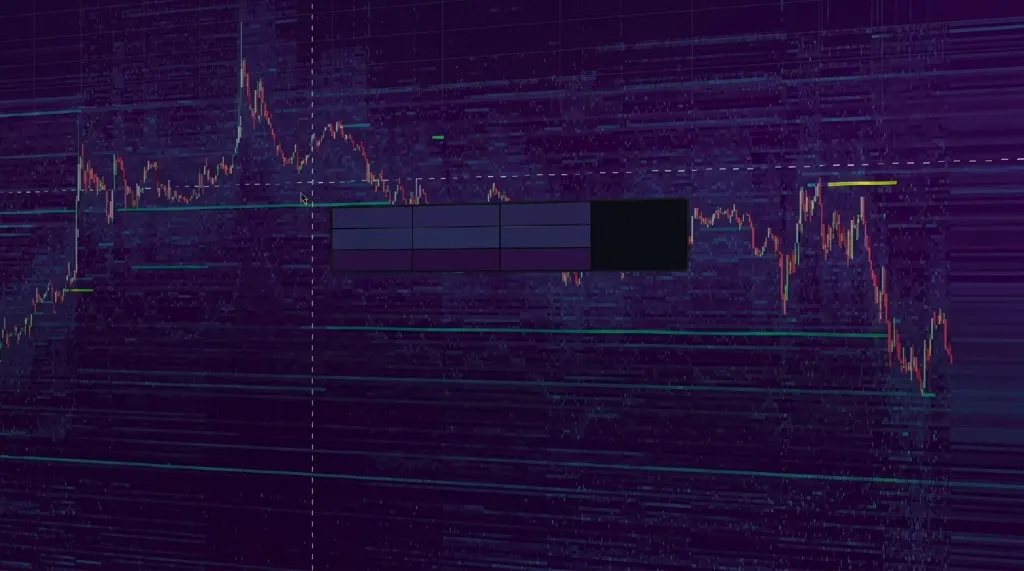
Order Book Heatmaps Explained: Spotting Spoofed Liquidity
Not every wall on the order book is real. Here's how to use a depth heatmap to tell genuine liquidity apart from bait — before it moves against you.
 Derivatives
Liquidation Maps 101: Trading the Squeeze Before It Happens
Leveraged positions have a breaking point, and those breaking points cluster. Here's how to read a liquidation map before the cascade, not after.
Stop guessing. Start reading the tape.
Full Pro terminal, free while we're in early access. Every day without it is a day trading blind.
No credit card · Full Pro during early access