Liquidity Sweeps and Stop Hunts: Reading the Grab Before It Triggers
Price spikes through the obvious level, triggers a wave of stops, then reverses without you. That's a liquidity sweep — here's how to see it coming.
HODLChart Team
July 12, 2026 · 4 min read
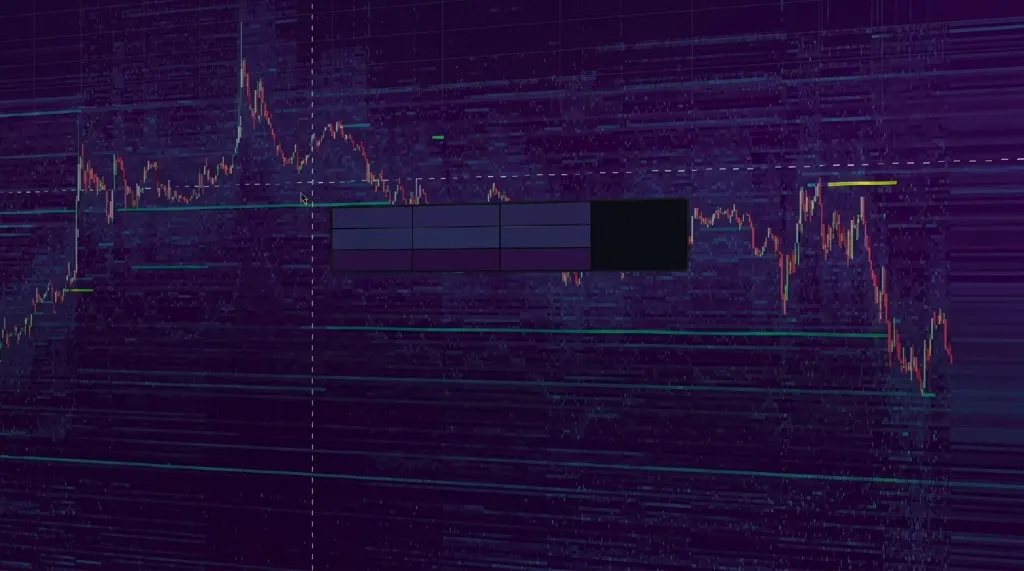
You set your stop just below the swing low, where any sensible trader would. Price drifts down, spikes clean through it by a few ticks, fills you at the worst possible price — then reverses and runs without you. It feels personal. It isn't. It's a liquidity sweep, and once you understand why it happens, you stop being the one it happens to.
Your stop is someone else's liquidity
A stop-loss is just a resting order that turns into a market order the instant price touches it. Cluster thousands of them in one spot and you've built a pool of guaranteed fills. That matters because large players have a problem retail doesn't: they can't get filled without moving price against themselves. If a desk needs to buy real size, it needs a wave of sellers to buy from — and a cluster of long stops below the low is exactly that. Triggering those stops manufactures the liquidity they need to enter. The sweep isn't malice. It's mechanics.
Where stops cluster
Sweeps target the same handful of places because that's where everyone hides the same orders:
- Just below obvious swing lows and above swing highs — textbook stop placement, which is exactly the problem.
- Round numbers. 60,000, 65,000, 70,000 — psychological magnets where stops and resting orders pile up.
- Equal highs and equal lows. A clean double top looks like resistance to you; to a desk it looks like a labeled pool of stops.
- Just beyond the prior day's high or low, and the session extremes — reference points the entire market is watching at once.
The anatomy of a sweep
Every sweep follows roughly the same script, and it's visible if you know the sequence to look for:
- Price drifts toward an obvious level with stops stacked just beyond it — often on shrinking volume, almost baiting the move.
- A sharp spike pierces the level, triggering the stop cluster and any leveraged liquidations sitting there.
- That forced flow gets absorbed by large passive orders waiting on the other side — the entire point of the exercise.
- Price snaps back through the level it just swept, leaving a long wick and trapping everyone who chased the break.
Sweep or real breakout? Reading it live
The hard part is telling a sweep from a genuine breakout in the moment, because they start identically. The difference never shows up in the candle — it shows up in the order flow. This is where a single chart fails you and a stacked read earns its keep, which is the whole reason HODLChart puts the heatmap, footprint, and liquidation map on one screen instead of making you tab between three tools while the move happens.
On a real breakout, price clears the level and liquidity follows it — the book rebuilds above, aggressive volume keeps pushing, CVD confirms. On a sweep, the tells are the opposite:
- The wall you were watching on the heatmap pulls a moment before price arrives — the liquidity was never there to break through.
- The footprint shows heavy absorption on the spike: big volume, almost no price progress. Someone is soaking it up.
- The liquidation cluster beyond the level gets cleared in a single candle, then nothing — the fuel is spent.
- CVD diverges on the wick: price makes the new extreme, delta doesn't confirm it.
The stop-placement trap
If the level is obvious to you, it's obvious to everyone — which is exactly why the stops sitting just beyond it are the first thing to get taken. The most-watched level on the chart is the least safe place to hide an order.
The market doesn't hunt your stop because it knows you. It hunts your stop because ten thousand people put theirs in the same place.
Trading with the sweep, not into it
- Mark the pools before the session — swing highs and lows, equal highs and lows, round numbers, prior-day extremes. Those are the targets.
- Expect the sweep near those levels instead of trusting the first break through them.
- Wait for the reclaim: price sweeping the level and then closing back inside is the signal, not the spike itself.
- Confirm with absorption on the footprint and a pulled wall on the heatmap before entering the reversal.
- Place your own stop beyond the sweep's wick, not at the obvious level everyone else used — the entire point is to not be sitting in the pool.
The mistakes that make you the liquidity
- Putting your stop exactly where the textbook says, a few ticks past the obvious level, alongside the whole herd.
- Chasing the breakout candle before price confirms it holds — sweeps are built to catch precisely that entry.
- Trading the sweep off price alone, ignoring the heatmap and footprint, which is how you get trapped on both sides of it.
- Trading sweeps on thin pairs where a single order can fake the entire move.
Stop hunts get talked about like a conspiracy, but there's nothing secret about them. Leverage and stops pile up in predictable places, and the market goes to get them because that's where the liquidity is. Learn where the pools sit and read the flow when price arrives, and the sweep stops being the thing that takes you out — and starts being the thing that tells you where the real move begins.
Keep reading
 Order Flow
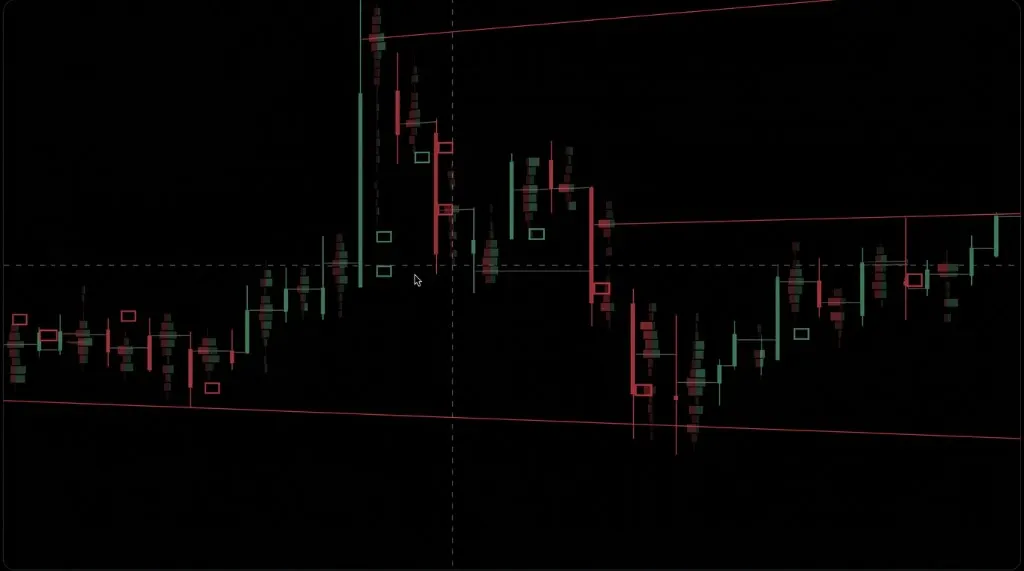
Reading Footprint Charts: A Practical Guide to Order Flow
Footprint charts show you exactly where volume traded inside every candle. Here's how to actually read one without getting lost in the numbers.
Order FlowOrder Book Heatmaps Explained: Spotting Spoofed Liquidity
Not every wall on the order book is real. Here's how to use a depth heatmap to tell genuine liquidity apart from bait — before it moves against you.
 Derivatives
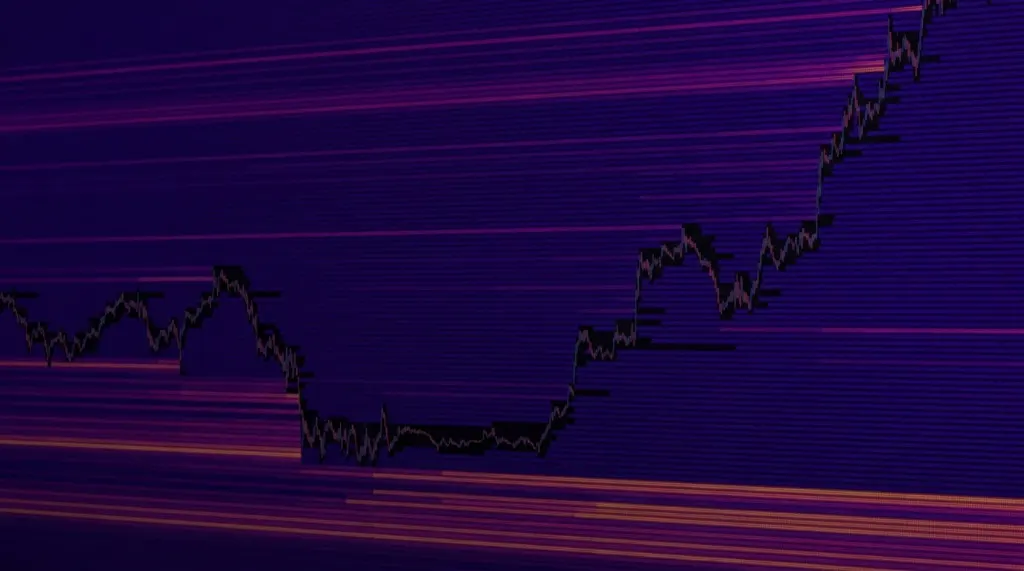
Liquidation Maps 101: Trading the Squeeze Before It Happens
Leveraged positions have a breaking point, and those breaking points cluster. Here's how to read a liquidation map before the cascade, not after.
Stop guessing. Start reading the tape.
Full Pro terminal, free while we're in early access. Every day without it is a day trading blind.